
Ask your question in plain language and get a visualisation of your school data.
What the Copilot does for you
In a cockpit the captain sets the course and the second pilot reads the instruments. The Copilot in TRIPS works the same way: you ask the question and take the decisions, the Copilot looks up the data and puts it on screen.
You describe in plain language what you want to see, for example ‘absence per class this school year’. The Copilot builds that visualisation in your TRIPS environment, explains what it shows and answers questions about your school’s data. So you no longer have to gather, calculate and check the right figures yourself.
The Copilot takes over the searching and the drawing, not the judgement. You check whether the visualisation matches what you know about your school and decide what to do with it. The time you save can go into discussing the figures with your team.

Your school data on screen, from a question in plain language.
The TRIPS Copilot in action
Three screen recordings from a TRIPS environment.
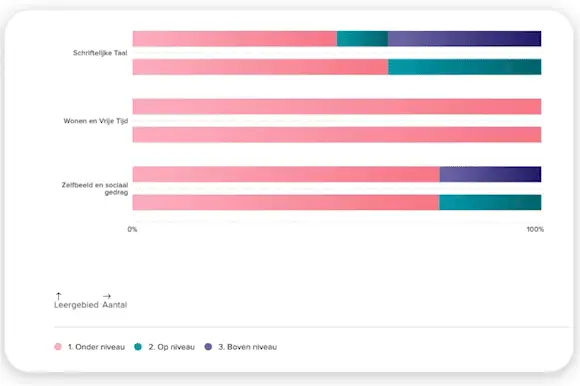
Having a visualisation built
Describe what you want to see, for example a group’s test results over the last three administrations. The Copilot builds that visualisation with your school’s data. If it is not quite right, you ask a follow-up question or adjust it yourself.
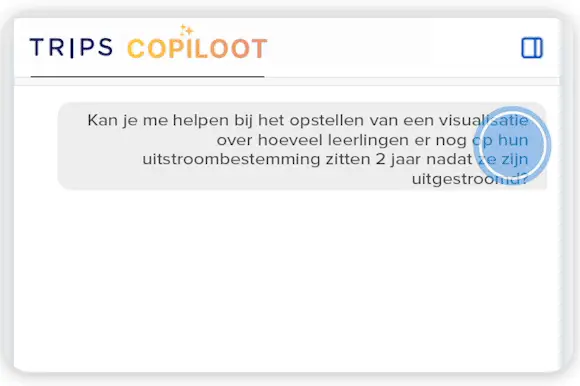
Asking questions about your data
Talk to the Copilot about the school data. Ask, for example, which class has the highest absence, what an outlier means, or for a short summary of what you see.
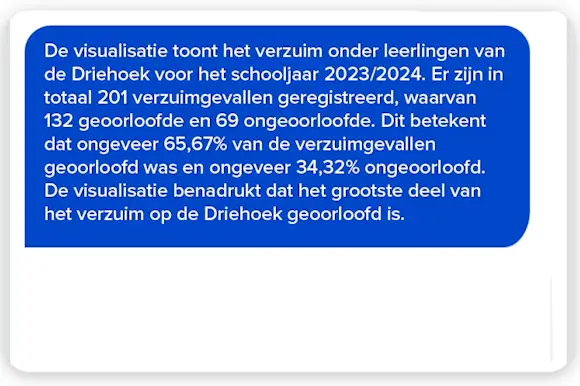
An explanation with every visualisation
The Copilot writes an explanation with a data visualisation: what it shows and what stands out. You read that text through and use it in a report or as the start of the conversation with your team.
Want to get started with the Copilot?
Leave your e-mail address. We will send you more information about what the Copilot can do for your school and sector.
Nine ways the Copilot helps you work with education data

A visualisation from a question
Describe in plain language what you want to see. The Copilot builds the visualisation; you check whether it is right.

An overview of the main trends
A summary of what is happening and changing in your data, available for every visualisation.

A visualisation for every data question
Every question to the Copilot produces a visualisation. You do not have to work out yourself which chart fits your question.

Guidance in small steps
The Copilot helps you in small steps towards a visualisation that fits your question.

An explanation with every visualisation
Every visualisation gets a written explanation. You read it through and use it in your report or meeting.

Tips for analysing your data
Get support on how best to analyse a visualisation. On your own, with a colleague or with your team.

Visualisations for a specific group
Set up a visualisation for a group, a pupil or a period.

In conversation with your data
Ask follow-up questions about a visualisation or get an explanation of data you do not understand.

Guiding questions for the conversation with your team
The Copilot draws up guiding questions with which you discuss the data with your team.
Want to use the Copilot at your school too?
The Copilot is included in TRIPS as standard and works in Explore and in the management report, with the data in your TRIPS environment. It helps you and your team to find, visualise and discuss data. Get in touch to hear what that asks of your school.